
Description
You found a property. The agent sent a listing price, maybe a rental estimate. Now you need to know whether this thing actually makes money — or whether you’re buying someone else’s problem with a fresh coat of paint.
This spreadsheet runs the numbers that matter. Not a vibe check. Not a napkin sketch at a braai. The actual calculations a lender, a partner, or your own accountant would want to see before anyone signs anything.
What it calculates
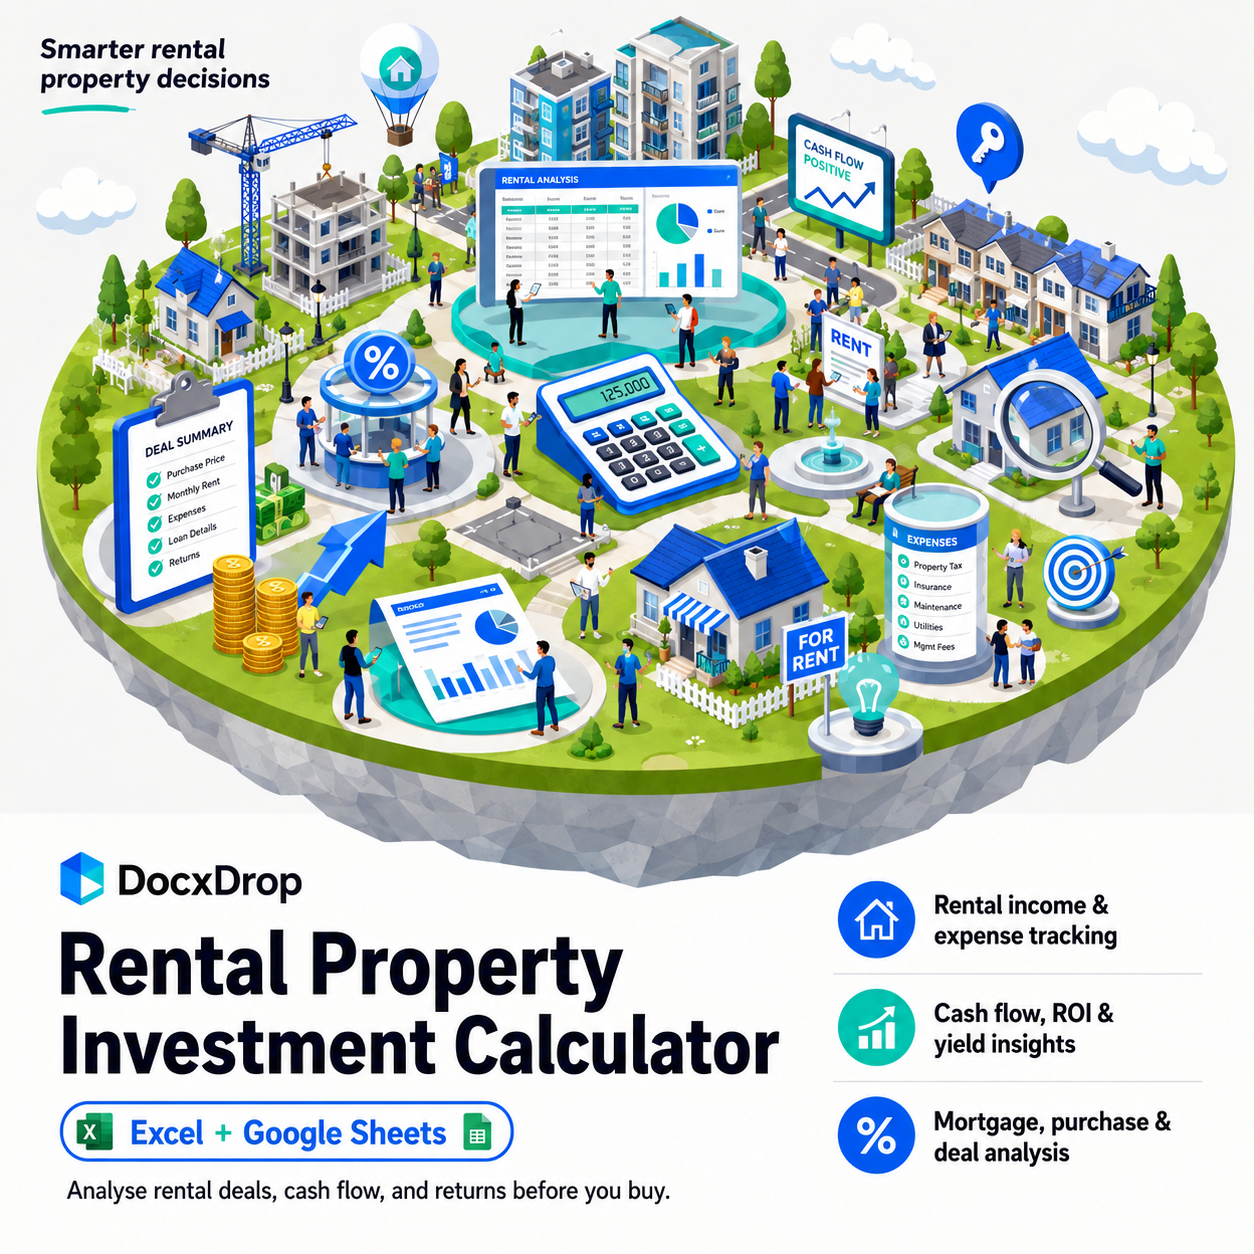
Cap rate. Cash-on-cash return. Net operating income. Debt service coverage ratio. Internal rate of return (IRR). Net present value (NPV). Monthly cash flow. Cumulative cash flow over 10 years. Estimated property value at exit. Net sale proceeds after selling costs and remaining loan balance. An NPV sensitivity table that shows what happens when your required return shifts up or down.
What’s in the file
Six tabs, one job:
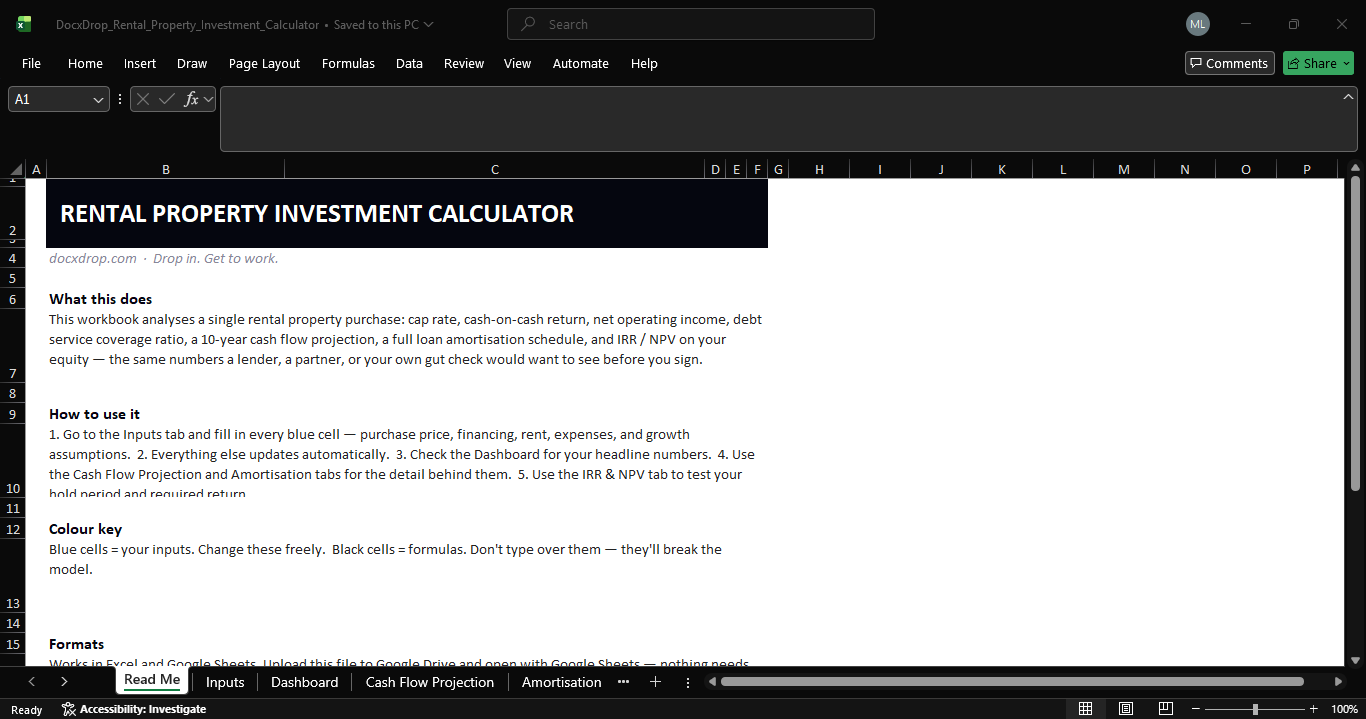
Read Me — what the file does, how to use it, and a colour key so you know which cells are yours and which ones to leave alone.
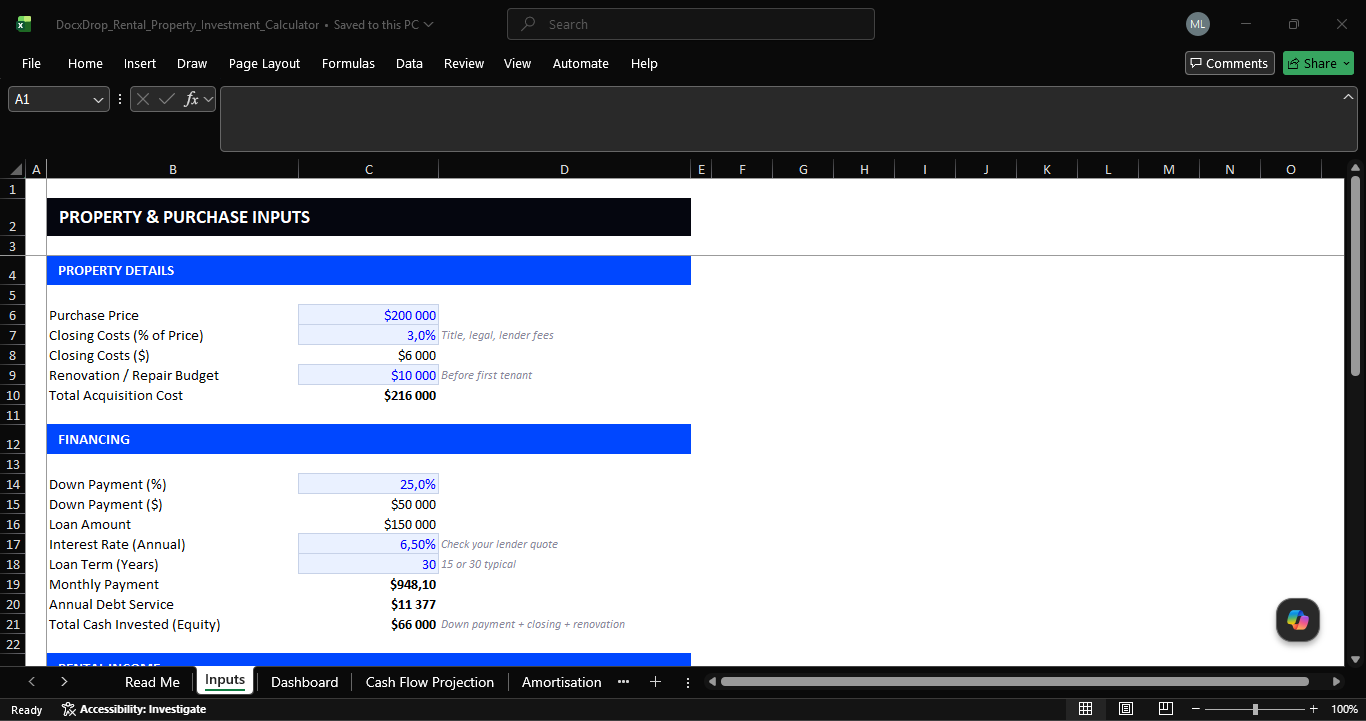
Inputs — every assumption in one place. Purchase price, closing costs, renovation budget, down payment, interest rate, loan term, monthly rent, vacancy rate, seven operating expense lines, rent growth, expense growth, property appreciation, holding period, selling costs, and your discount rate. All blue cells. All yours to change.
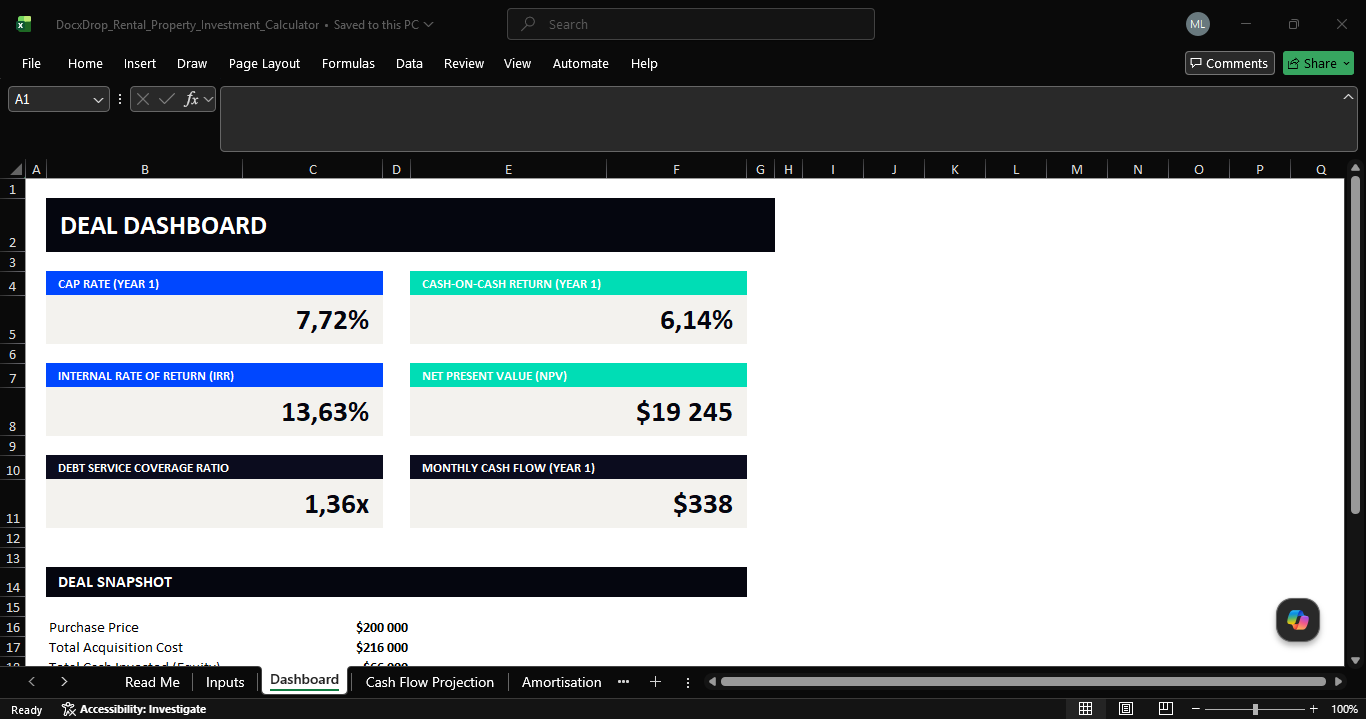
Dashboard — six headline metric cards at the top (cap rate, cash-on-cash, IRR, NPV, DSCR, monthly cash flow) and a deal snapshot table underneath pulling purchase price through to net sale proceeds. One screen. The whole story.
Cash Flow Projection — a 10-year annual build. Gross rental income through to cash flow before tax, with a full expense breakdown, key ratios by year (cap rate, cash-on-cash, DSCR, operating expense ratio), and an exit analysis showing estimated property value, selling costs, remaining loan balance, net sale proceeds, and total return on equity — for every year.
Amortisation Schedule — 360 months of beginning balance, payment, interest, principal, and ending balance. Feeds the remaining loan balance into the exit analysis automatically.
IRR & NPV — your equity cash flow timeline from Year 0 (your cash in) through Year 10, with sale proceeds added at your chosen holding period. IRR and NPV results. A seven-row sensitivity table varying the discount rate ±4% so you can see how the deal holds up under different return expectations.
Who this is for
Marcus is looking at a duplex in Austin and needs to know whether the rent covers the mortgage before he calls the agent back. Sipho found a flat in Observatory listed below market and wants to see what the IRR looks like over a 10-year hold. Priya’s partner wants to invest in a buy-to-let in Birmingham and she needs a spreadsheet that doesn’t require a finance degree to read. Adaeze is comparing two properties in Lekki and wants the cap rate and cash-on-cash side by side without paying for software she’ll use twice.
If you’re buying rental property and you need to know whether the numbers work — not whether the kitchen looks nice — this is the file.
What this is not
This is not a portfolio tracker. It analyses one deal at a time. It does not include tax calculations (talk to your accountant — tax treatment varies by country). It does not forecast rental demand or tell you which neighbourhood to buy in. It runs the financial model. You bring the judgment.
Format and compatibility
One .xlsx file. Works in Microsoft Excel (2016 or later) and Google Sheets — upload to Google Drive and open with Sheets, no conversion needed. All formulas are native Excel functions (PMT, IRR, NPV, INDEX, IFERROR). No macros. No plugins. No VBA.